Dialogs
Molecule Box Dialog
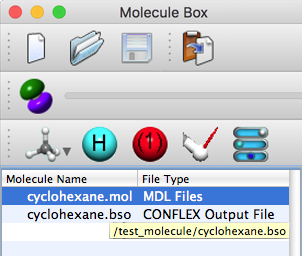
A list of open files is displayed. The file path is displayed by mousing over the filename.
Each toolbar icon corresponds to a menu item (see below).
The progress bar shown in the next row is used for longer processes, such as loading large files or creating molecular orbitals.
Property Box Dialog
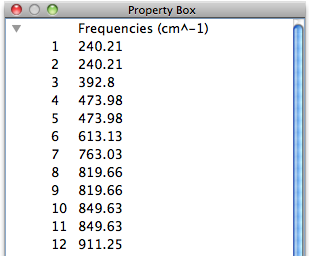
The properties of an open file are displayed here. The display changes depending on the type of file opened. Examples of the vibration display are as follows.
In the case of files resulting from crystal search, sorting is possible by clicking on the header.
Object inspector Dialog
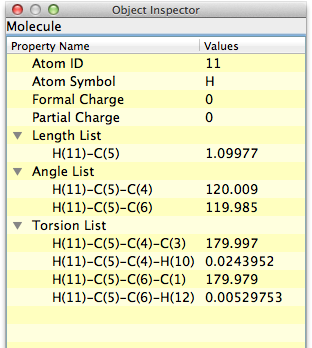
Information on files and atoms is displayed here in accordance with the selected state of the molecule.
Summary List Dialog
This dialog displays a summary of the calculation and other information when the resulting file is opened.
For example, after a CONFLEX conformational analysis, a conformation list will be listed.
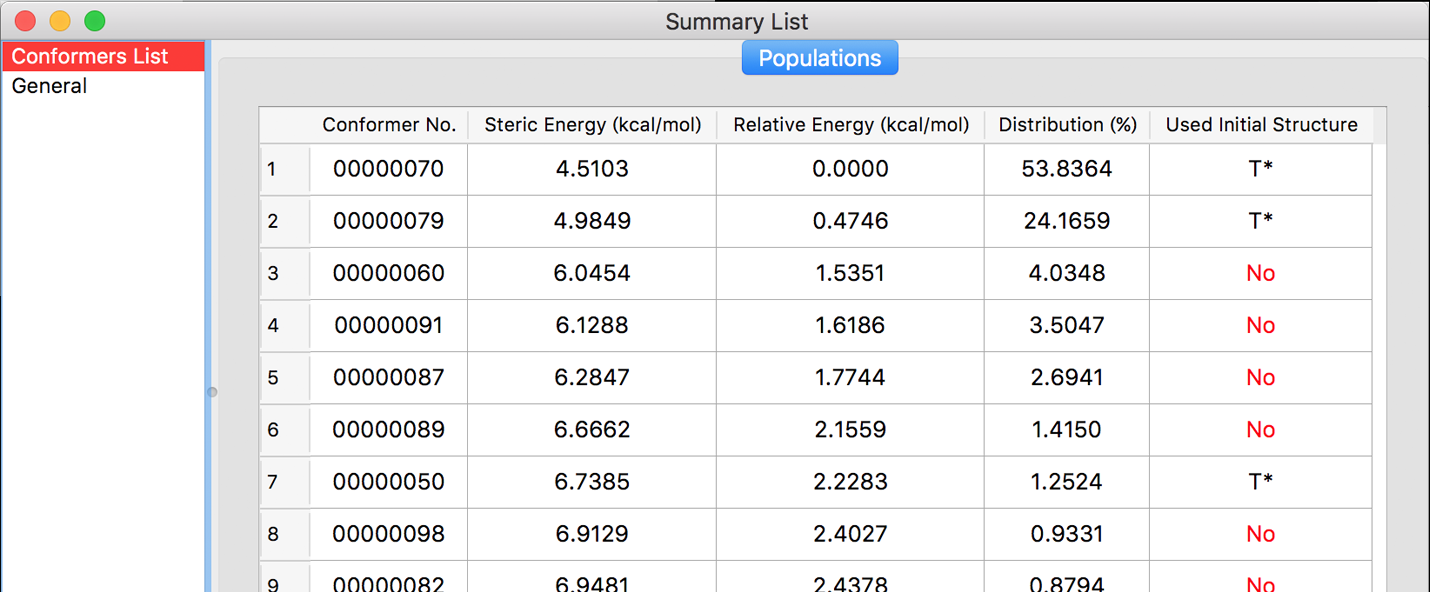
A list of conformers are displayed in ascending order of energy.
- Conformer No.
- Numbered in serial order as CONFLEX found.
- Steric Energy
- Steric Energy of conformers by Molecular Mechanics.
- Relative Energy
- Relative energy compared to most stable conformer.
- Distribution
- Probability distribution based on confomer energy.
- Used Initial Structure
- “Yes” indicates that a conformer was selected as starting structure during conformation search. If all conformers within Search Limit have a “Yes” flag, CONFLEX Conformation Search has finished.
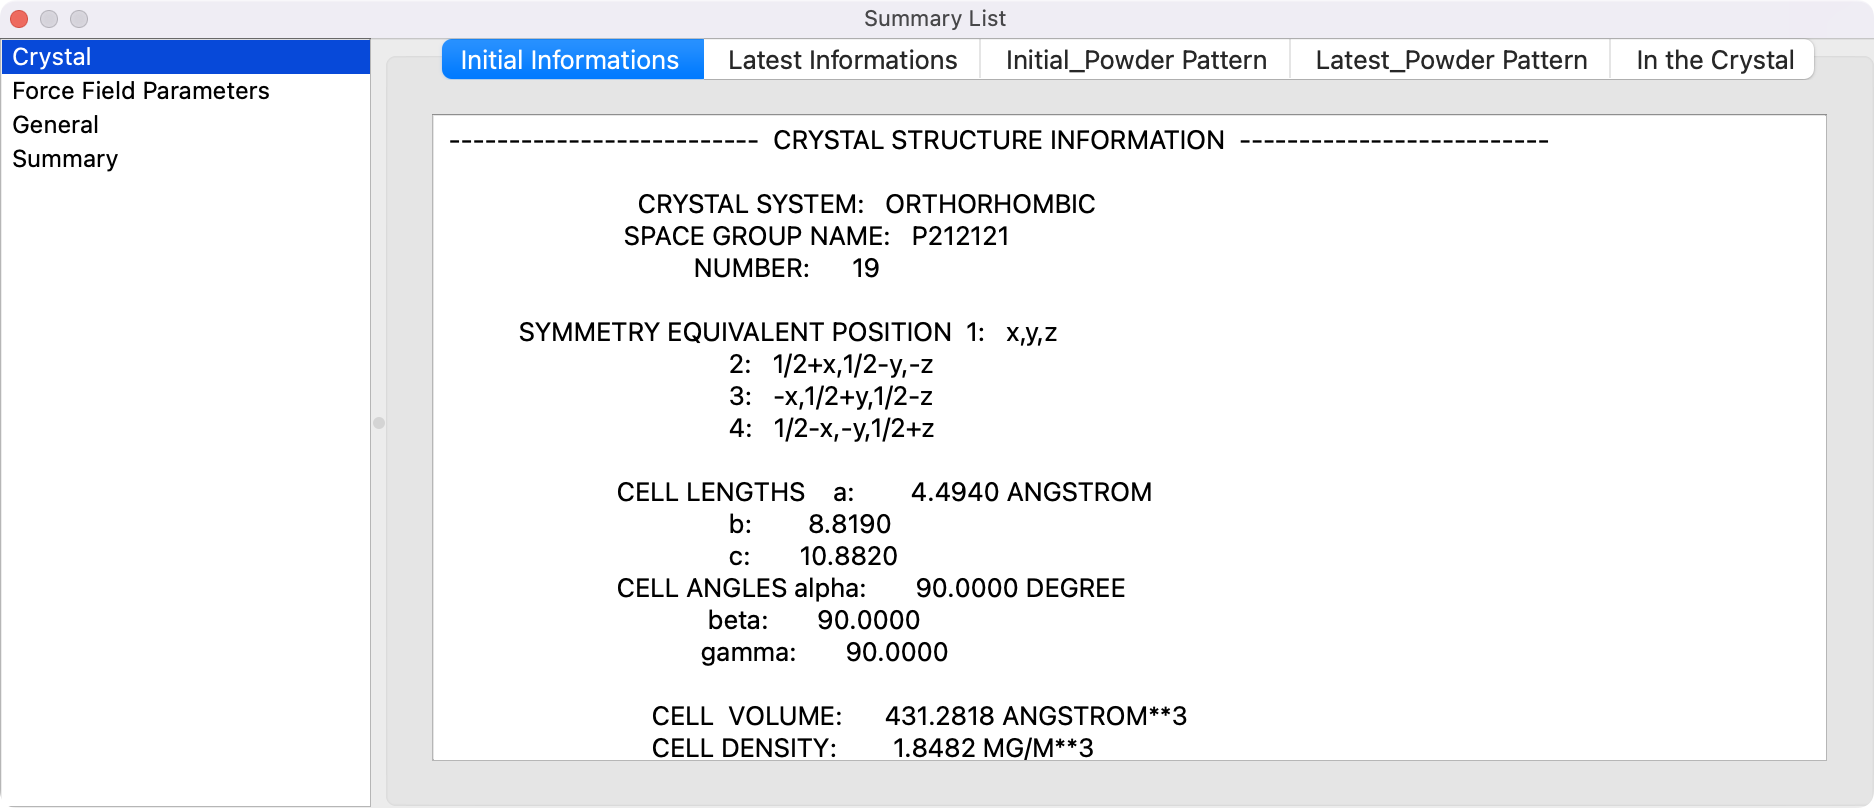
When you open a bso file after crystal structure optimization, you will see information about the crystal.
Crystal Editor Dialog
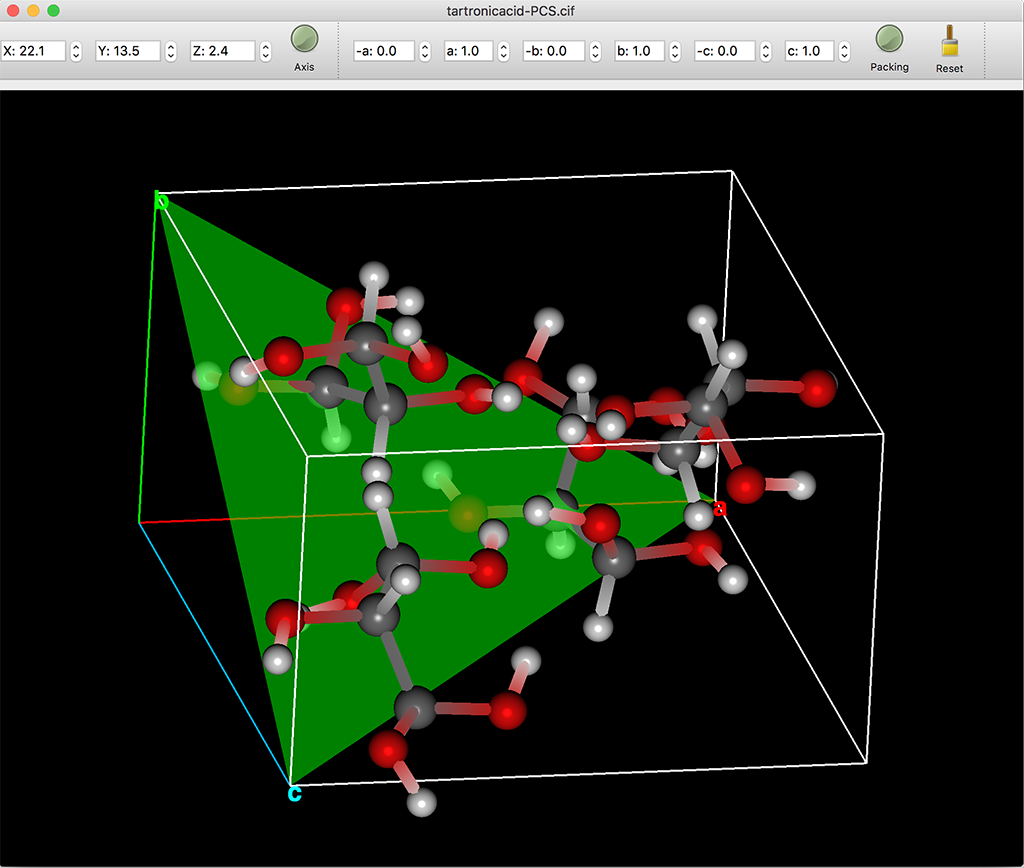
If molecule file contains Crystal Data, Interface can display Crystal Surfaces defined by Miller's Indices.
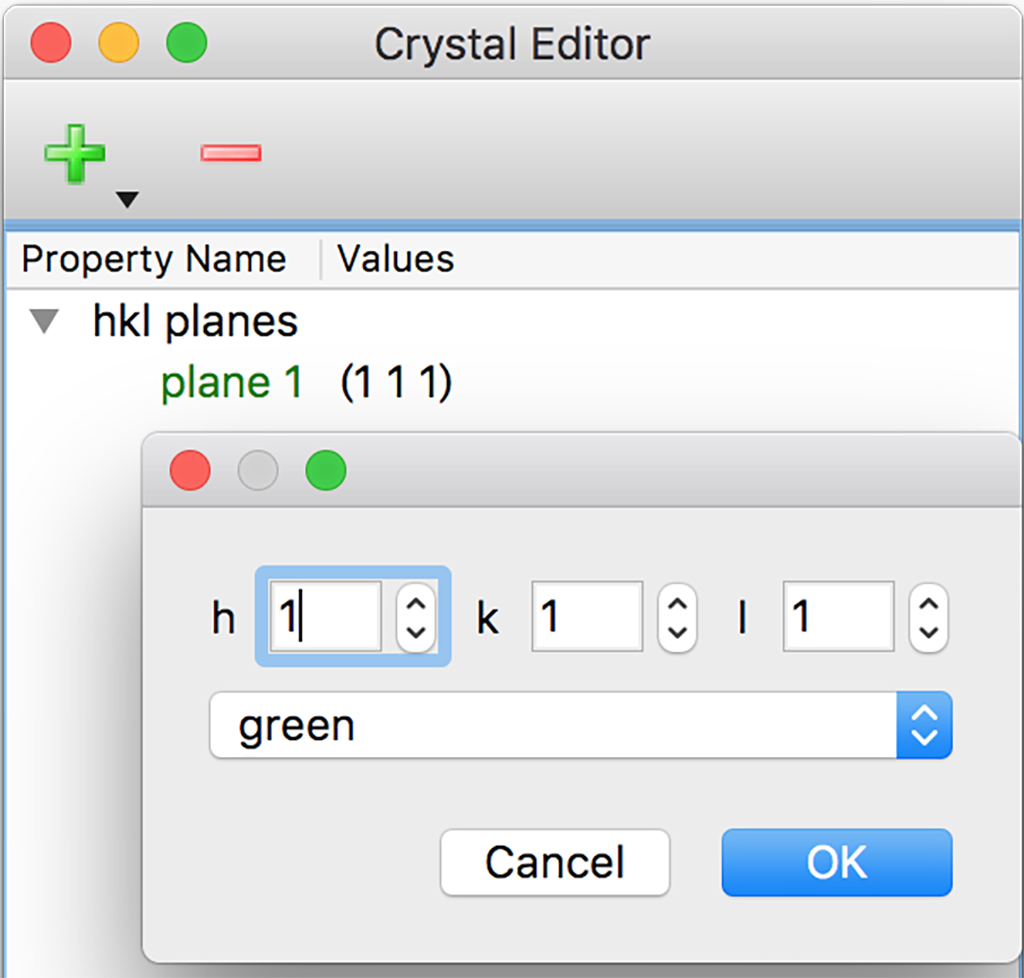
Clicking the ‘+’ icon, Miller's Indices dialog opens. You can specify Miller's Indices (h, k, l) and surface color.
Click on the ‘-’ icon to delete the selected surface.
IR Plotter Dialog
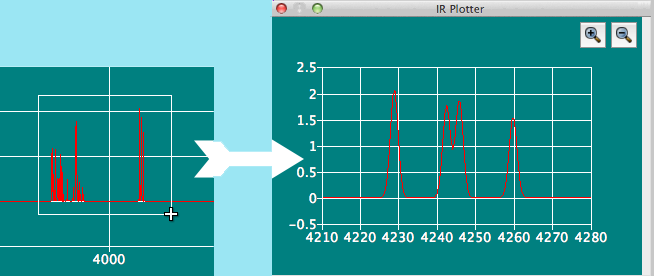
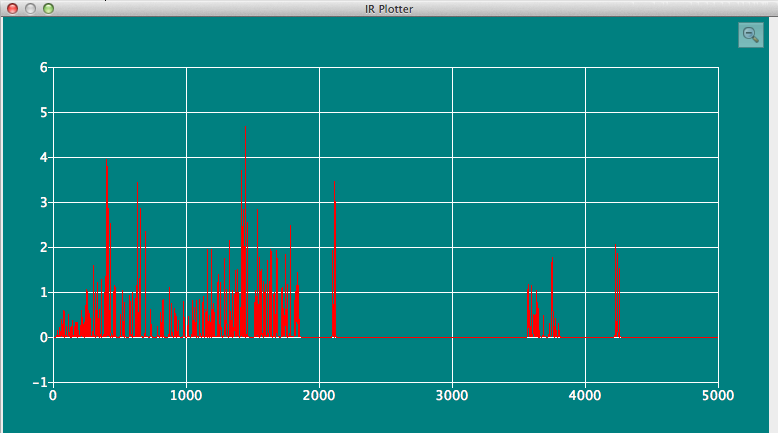
If molecule file contains Vibrational Data, Interface can display a spectra.
This plot can be zoomed using the mouse move with button down operation.
Clicking the magnifying glass icon, spectrum will be zoomed in or out. The zoom in and out ratios are set according to the user's previous zooming in and out history.
- Support file formats:
- CONFLEX bso, Gaussian FChk and GAMESS/Firefly log format.
UV/Vis Plotter Dialog
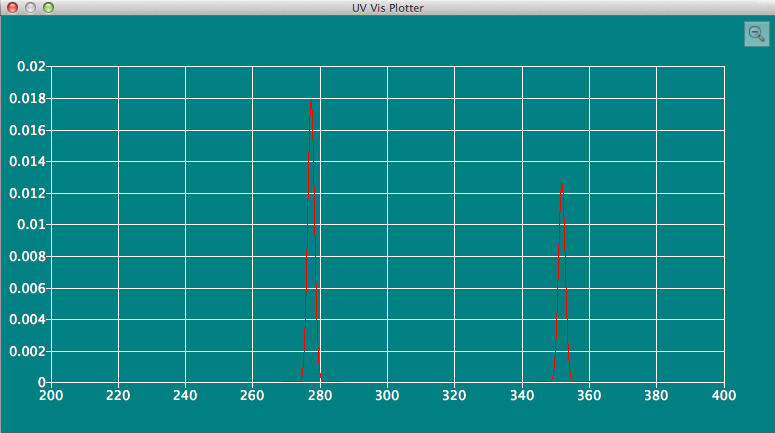
If molecule file contains a data of excited states calculation, this dialog displays the spectrum.
The spectrum can be zoomed in or out by same fashion with IR Plotter.
UV CD Plotter Dialog
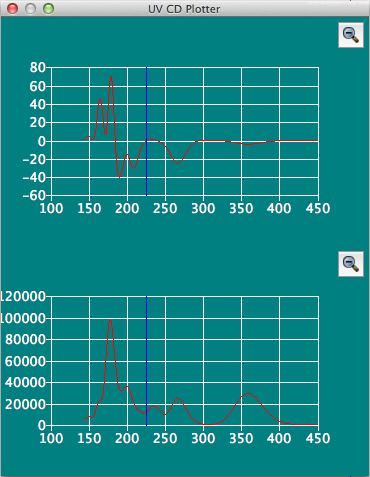
If CONFLEX bso molecule file contains a UV CD data, this dialog displays the spectra.
In addition to CD spectrum, UV spectrum is also displayed up and down. The blue line moves following mouse cursor to compare both spectra.
This spectra can also be zoomed in or out.
NMR Plotter Dialog
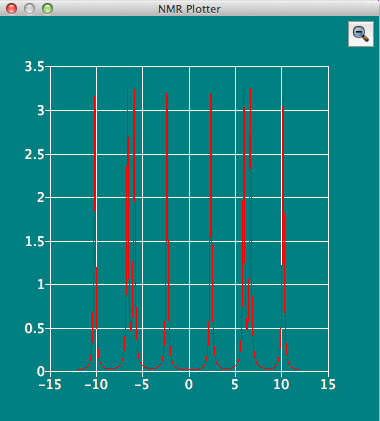
This dialog displays the result of CONFLEX NMR 3JHH calculation. If a NMR data file exist at the same location of calculation log file, NMR data will be loaded automatically.
To display NMR data, click ONE hydrogen atom in the molecule display window. The Plotter dialog displays peak shape according to a selected hydrogen atom.
This spectra can also be zoomed in or out.
